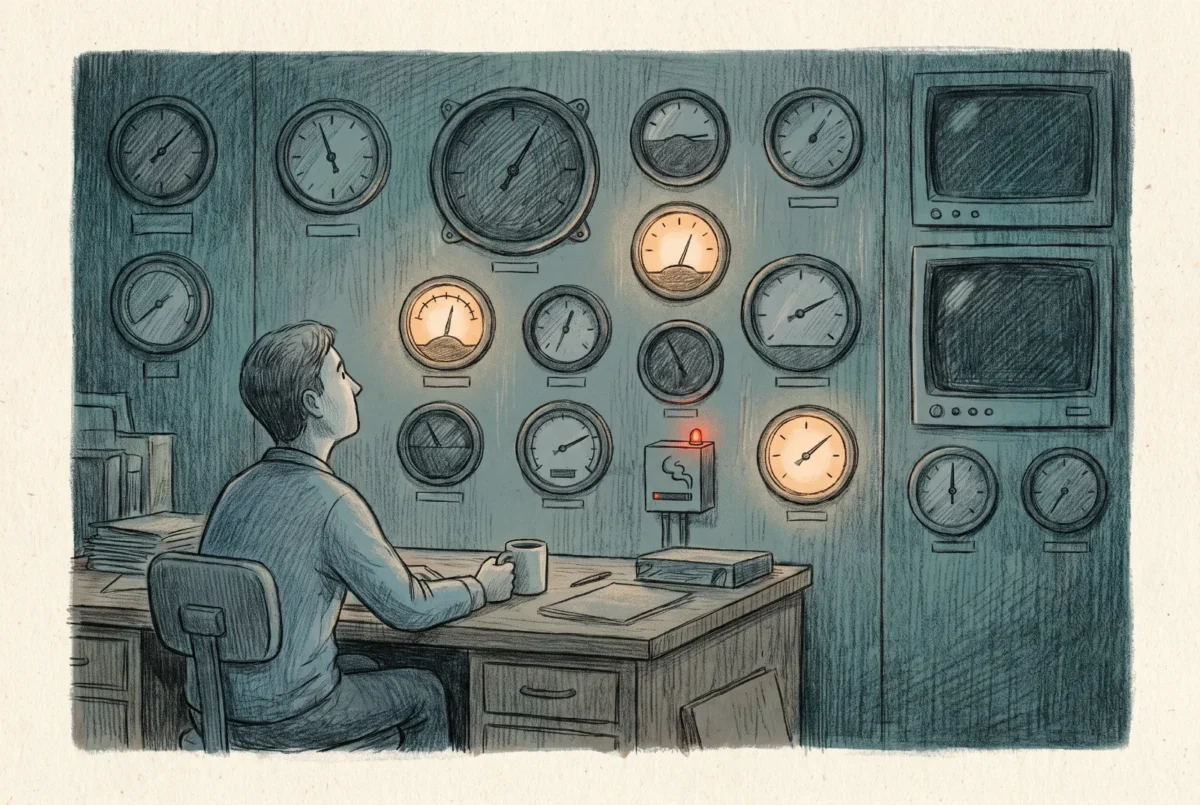

The instinct when you turn to monitoring is to look for the alerts page, set some thresholds, and move on. Intune will disappoint that instinct, because there is no single alert engine, and believing there is one is how tenants end up blind to the failures that actually take management down. What exists instead is three separate mechanisms with three different jobs, and knowing which is which is the whole discipline. The operating posture this feeds is [10.1] Day-Two Operations; this is how you build the instrumentation under it.
Three mechanisms, not one
The single most useful thing I can tell you about Intune monitoring is that the word alert means three unrelated things depending on where you are standing, and only one of them pushes you a notification. Sort them out first and the rest of the design falls into place.
| Mechanism | What it does | Does it notify? |
|---|---|---|
| Cloud PC alert rules | Configurable alert rules with thresholds and severities, the only native rule engine of its kind. Scoped to Windows 365, so provisioning failures, network-connection failures, image upload, grace periods. | Yes: in-console and optional email. |
| Tenant status connector page | Health status for the Apple push certificate, the Apple VPP token, and the certificate connector. A color, not an event: warning when a certificate is within seven days of expiry or a connector has not synced in over a day, unhealthy once it has expired or gone three days without sync. | No. It is a passive status surface you have to go look at. |
| Azure Monitor over routed logs | The general-purpose path. You route Intune logs to a Log Analytics workspace and build your own query-based alert rules with real notifications and actions. | Yes, once you build it. Nothing is on by default. |
The trap sits in the middle row. The highest-consequence failures in the whole platform, an expired Apple push certificate that silently stops every iOS device from checking in, a VPP token gone invalid, a certificate connector that quietly stopped issuing, surface only as a status color on a page nobody visits. Native Intune will not email you when they break. That gap is the entire reason the third row exists, and closing it is the real work of setting up monitoring.
The reports are the dashboard, not the alarm
Intune’s reporting framework is genuinely good, as long as you treat it as instrumentation you read rather than an alarm that finds you. It sorts into operational reports for the timely, act-on-it detail a helpdesk lives in, organizational reports for the aggregate posture a manager wants, historical reports for the thirty-day trend, specialist reports that exist to be exported into your own tooling, and per-device reports for a single machine’s state. Endpoint analytics sits alongside all of it as the experience layer, scoring startup, app reliability, and work-from-anywhere readiness on a zero-to-one-hundred scale against a cross-organization baseline. The discipline is to know what you are looking at: none of this pages you, so it belongs in a review cadence, not in your hope that a problem will announce itself. The reports worth watching every day are covered in [10.4] Monitoring and Reporting.
Wiring the alerts you actually need
Real proactive alerting is an Azure Monitor build, and it is worth doing once, properly, on day one. You need a Log Analytics workspace, and then under the Intune reports diagnostics settings you route the log categories that matter: audit logs for who changed what, operational logs for enrollment success and failure, the device-compliance organizational feed, and the device inventory feed. Send them to the workspace, and now you can write a query and attach a scheduled-query alert rule with an action group that emails, posts, or opens a ticket.
Two facts keep this honest. The audit and operational logs land in about half an hour, but the compliance and device feeds can take up to forty-eight hours, so do not build a real-time alarm on data that arrives two days late. And the export can duplicate records inside a day, so any query that counts needs to deduplicate. A minimal enrollment-failure alarm looks like this, run on a schedule with a threshold on the count:
IntuneOperationalLogs
| where TimeGenerated > ago(1h)
| where OperationName == "Enrollment"
| where ResultType == "Failure"
| summarize failures = dcount(CorrelationId) by bin(TimeGenerated, 15m)
| where failures > 10
The point is not this exact query. It is that the notification engine for everything outside Windows 365 is something you assemble in Azure Monitor, and until you do, your tenant has dashboards but no smoke detectors.
What to watch, and what to ignore
The signals worth an alert are the ones where failure is silent and the blast radius is the whole platform. Watch the Apple push certificate, the VPP and ADE tokens, and the certificate connector, because each one breaks a whole class of devices with no user-visible warning, and the native surface only turns amber seven days out. Watch enrollment failure as a rate rather than as single events, and watch connectors that stop syncing. These are the alarms that earn their keep.
Just as important is refusing to alert on noise, because an inbox full of false alarms is the same as no monitoring. Point-in-time noncompliance is mostly check-in timing, not a real failure, so alert on sustained noncompliance, never on a single evaluation. The classic false positive is a device flipped noncompliant because Defender reported it inactive after roughly a week offline rather than because anything is actually wrong; treat that pattern as expected churn. A single stop-error or one app crash is meaningful only when anomaly detection groups it into a correlated cohort, and an individual device’s startup-score dip is trend data, not an incident. Good monitoring is as much about what you deliberately stay silent on as what you catch. The quarterly review that consolidates the status surfaces this page cannot page you about is [10.2.1] The Intune Health Review.
Intune Deployment Guide · Phase 10: Day-Two Operations
‹ Previous: [10.1] Day-Two Operations: Keeping Intune Boring on Purpose
Next: [10.2] Scaling Without Losing Your Mind ›